In its simplest form, the graph data should be presented as a series of lines. Each line consists of an x-value followed by up to eight y-values, separated by commas.
Blank lines, lines containing only whitespace, and lines beginning with a hash ('#') are treated as comments and ignored.
Each value should be a number. It will be parsed as a floating-point number, so simple integers as well as things like 4.05 and 5.1e4 are accepted.
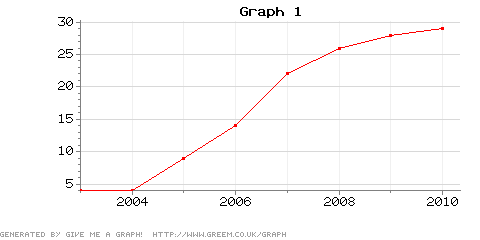
# Graph 1

2003, 4
2004, 4
2005, 9
2006, 14
2007, 22
2008, 26
2009, 28
2010, 29
The first column in the graph contains points on the x-axis, and the other columns describe the corresponding points on the y-axis. The above data will produce this graph:

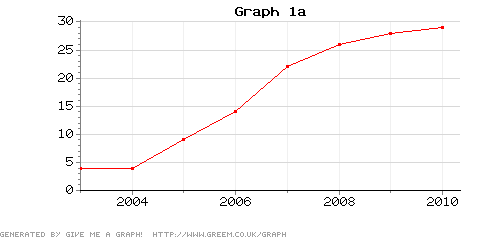
To show the x-axis, we can set the y-axis start value to 0:
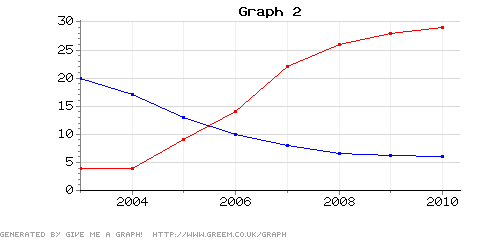
To draw two lines on the same graph, simply enter two y-values for each row in the data. Each row must have the same number of y-values in it. In this case, there are two on each row.
# Graph 2

2003, 4, 20
2004, 4, 17
2005, 9, 13
2006, 14, 10
2007, 22, 8
2008, 26, 6.5
2009, 28, 6.2
2010, 29, 6
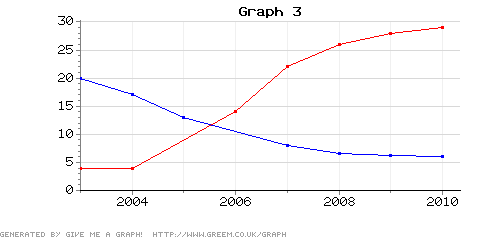
Suppose we don't have any data for the red line for 2005. We must give two values for 2005, because that's the number of values every other row has. To indicate the absence of any data, leave the field blank. In graph 3 below, we'll say we don't know the red data for 2005, or the blue data for 2006.
# Graph 3

2003, 4, 20
2004, 4, 17

# Red missing
2005, , 13

# Blue missing
2006, 14,

2007, 22, 8
2008, 26, 6.5
2009, 28, 6.2
2010, 29, 6
Points can be labelled. To label a point, put the text in parentheses after the corresponding y-value. In this example, we'll label the red line's 2006 value and the blue line's 2009 value. We'll also give the graph a title, axis labels and a key, by entering the appropriate values into the controls on the form.
# Graph 4

2003, 4, 20
2004, 4, 17

# Red missing
2005, , 13

# Blue missing
2006, 14 (Monsters send reinforcements),

2007, 22, 8
2008, 26, 6.5
2009, 28, 6.2 (Monster-proof bunker completed)
2010, 29, 6
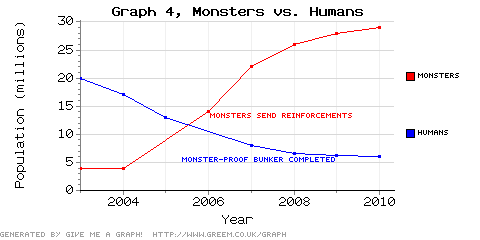
The program decides for itself where around the point to print the label, based on how cluttered the various locations are. It tries to put it in the least cluttered area around the point, and often succeeds.
If you want parentheses in the label text, you need to precede them with a backslash ('\') so they don't get mistaken for the start or end of a label. To include a literal backslash in the label text, precede it with another backslash. So if, for some reason, you wanted the label text foo (bar) \baz, you would enter this as (foo \(bar\) \\baz).
If labels are tagged onto the x-axis value of a row, rather than any of the y-values, then the x-axis is labelled at that point. This allows the x-axis to be labelled with month names, weekday names, or anything else. Note that if there are any x-axis labels, it doesn't print any numbers on the x-axis; the labelling is completely down to you.
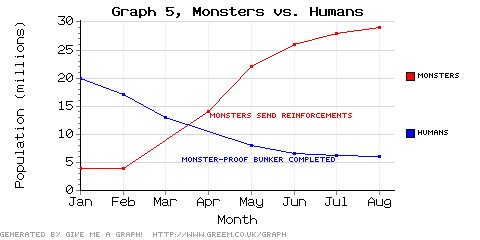
For the sake of argument, we'll say this hypothetical monster invasion took place over months rather than years. We then might have a table like this:
# Graph 5

0 (Jan), 4, 20
1 (Feb), 4, 17

# Red missing
2 (Mar), , 13

# Blue missing
3 (Apr), 14 (Monsters send reinforcements),

4 (May), 22, 8
5 (Jun), 26, 6.5
6 (Jul), 28, 6.2 (Monster-proof bunker completed)
7 (Aug), 29, 6
Note that the numbers still have to be given for the x-axis, so the program knows how far apart to put the labels.
